Workforce planning for 2027 means balancing several priorities: retaining employees, managing employment costs, addressing skills gaps and ensuring teams have the capacity to meet business goals. For South African HR leaders, these decisions also come against a changing labour market. Statistics South Africa reported an official unemployment rate of 33.6% in the second quarter of 2026, while employment in the formal non-agricultural sector declined by 95,000 jobs year-on-year to June 2026.
Before setting next year’s HR priorities, review the followinf workforce metrics to understand what is happening within your organisation and where your attention is needed.
1. What is your employee turnover rate?
Your employee turnover rate shows how many employees leave your organisation over a specific period. It helps you understand workforce stability and whether your organisation is struggling to retain talent.
A high turnover rate can point to several issues, including limited career development opportunities, poor management, inadequate compensation or a lack of employee engagement.
Before setting your 2027 priorities, review:
- Your overall employee turnover rate over the past 12 months.
- Which departments or roles have experienced the most departures.
- Whether employees are leaving voluntarily or involuntarily.
- How long employees typically stay before leaving.
- The reasons employees give during exit interviews.
How to calculate employee turnover rate:
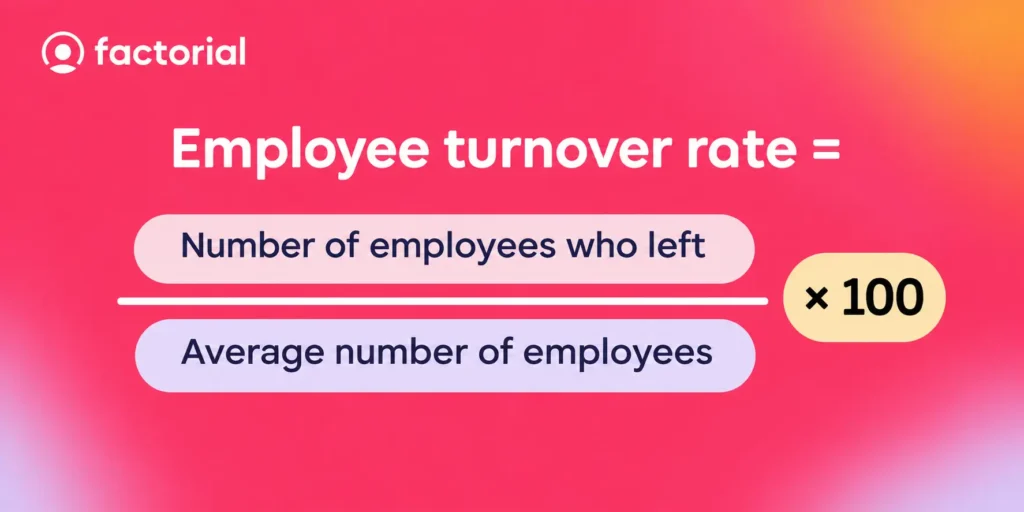
Employee turnover rate = (Number of employees who left ÷ Average number of employees) × 100
For example, if your organisation had an average of 200 employees and 20 left during the year, your turnover rate would be 10%. Use these findings to decide whether your 2027 priorities should include improving retention, reviewing compensation, strengthening management practices or creating clearer career development opportunities.
2. How often are employees absent from work?
Employee absenteeism measures how frequently employees miss scheduled working time. Reviewing this metric can help you identify attendance patterns, understand their impact on operations and determine whether additional employee support is needed. For example, if a particular department consistently records high absenteeism, you may need to investigate workload pressures, workplace conditions or employee wellbeing.
Review the following:
- Overall employee absenteeism rate.
- Unplanned absences across departments.
- Recurring absence patterns.
- Absence trends over different periods.
- The impact of employee absences on team capacity.
How to calculate the absenteeism rate:
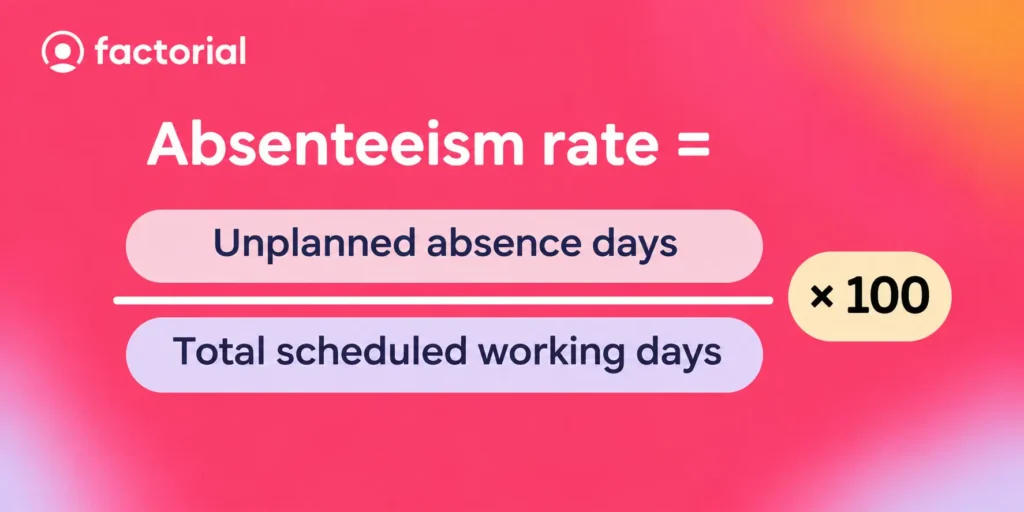
Absenteeism rate = (Unplanned absence days ÷ Total scheduled working days) × 100
For accuracy, establish a consistent definition of unplanned absence and distinguish it from approved annual leave and other authorised time off. This information can help you prioritise attendance management, workforce coverage and employee wellbeing initiatives for 2027.
3. How engaged are your employees?
Employee engagement gives you an indication of how connected employees feel to their work and the organisation. It can influence employee retention, motivation, collaboration and overall workplace experience.
However, engagement is not something you should assess through assumptions or performance figures alone. You need to understand how employees actually feel about working for your organisation.
Review:
- Employee engagement survey results.
- Employee satisfaction trends.
- Feedback from employee surveys and one-to-one meetings.
- Participation in engagement initiatives.
- Differences in engagement across departments.
For example, if employees consistently report limited opportunities for development or poor communication with managers, these findings could point to areas that need attention. Use the results to determine whether your 2027 HR strategy should focus on improving communication, strengthening management relationships, recognising employees or creating more opportunities for development.

4. How much are you spending on your workforce?
Labour cost per employee helps you understand how much your organisation spends on its workforce. It gives you a clearer picture of employment costs and whether your workforce budget aligns with business needs.
In South Africa, employment costs can include basic salaries, benefits, employer contributions, overtime and other employment-related expenses.
Statistics South Africa’s Quarterly Employment Statistics for June 2026 reported average monthly earnings of R30,611 in the formal non-agricultural sector for May 2026. This is a national sector-level figure, not a recommended salary or budgeting benchmark for individual organisations.
When reviewing your own workforce costs, consider:
- Average labour cost per employee.
- Salary and benefit expenditure.
- Overtime payments.
- Recruitment and onboarding costs.
- Training and development expenditure.
- Employment costs across departments.
How to calculate labour cost per employee:
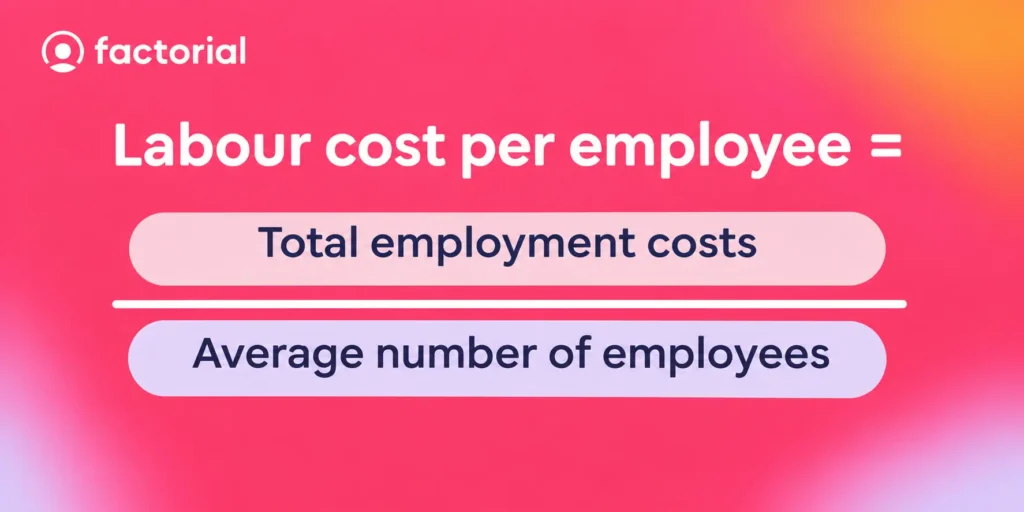
Labour cost per employee = Total employment costs ÷ Average number of employees
For example, if your annual employment costs are R24 million and your organisation has an average of 200 employees, your annual labour cost per employee is R120,000. This metric can help you identify where workforce spending is increasing and whether you need to review overtime, recruitment budgets, compensation structures or resource allocation in 2027.
5. Are your training and development initiatives delivering results?
Training and development metrics help you understand whether your organisation is investing in the right skills and preparing employees for future responsibilities.
This is particularly relevant when planning your 2027 workforce needs. You may have employees who need additional training to take on new responsibilities, adapt to changing technology or meet evolving business requirements.
Review:
- Employee training participation rates.
- Training completion rates.
- Training expenditure per employee.
- Skills gaps identified across departments.
- Progress against individual development plans.
- The impact of training on employee performance.
For example, if your organisation is planning to introduce new systems in 2027, you may need to invest in digital skills training before implementation.
South African employers should also consider how their skills development priorities relate to applicable Skills Development Act and SETA processes, including Workplace Skills Plans and Annual Training Reports where relevant. Do not measure training success through attendance alone. Consider whether employees have acquired the skills they need and whether those skills are being applied at work.
Your findings can help you decide which training programmes to prioritise and where to allocate your 2027 learning and development budget.
6. How productive are your employees?
Employee productivity measures how effectively your workforce contributes to organisational output and business objectives. Reviewing productivity helps you identify where teams are performing well and where processes, resources or workloads may need attention.
The right productivity measures will depend on the nature of your business. For example, a sales team may be assessed through revenue generated or sales targets achieved, while a manufacturing team may be measured through production output and quality.
Consider reviewing:
- Output against departmental targets.
- Project completion rates.
- Employee performance against agreed goals.
- Work completed within expected timeframes.
- Overtime and workload patterns.
Where appropriate, you can calculate output per labour hour:
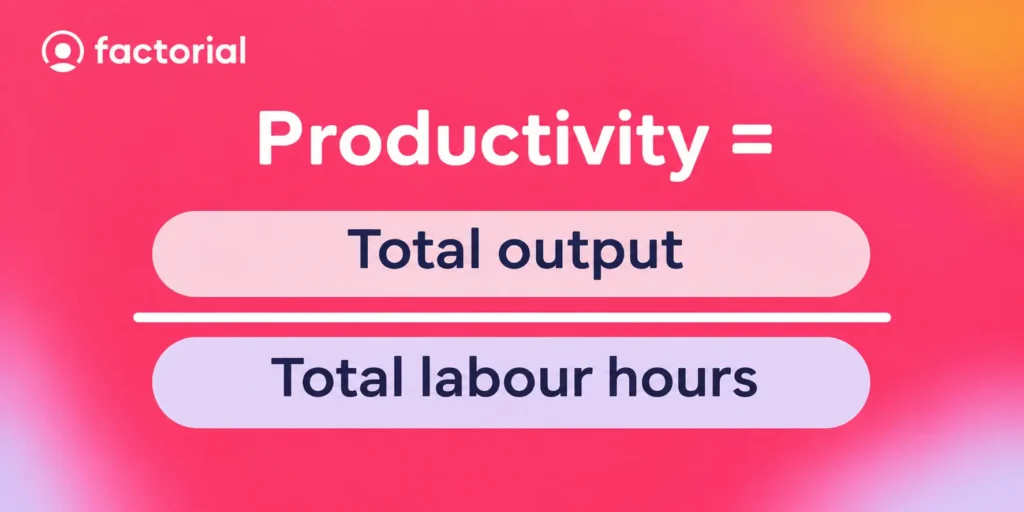
Productivity = Total output ÷ Total labour hours
However, avoid relying on hours worked as a measure of productivity. Longer working hours do not necessarily mean better results. If your review identifies consistently missed targets or uneven workloads, consider whether employees need additional resources, clearer objectives, better processes or further training. Use these findings to set realistic performance expectations and identify opportunities to improve productivity in 2027.
7. Does your current headcount meet your business needs?
Your headcount and workforce distribution figures help you understand how many people you employ, where they work and whether your current workforce structure supports your business objectives.
This is an important starting point for preparing your 2027 headcount plan.
Statistics South Africa reported that employment in the formal non-agricultural sector declined by 14,000 in the second quarter of 2026. The changes also differed across industries, with manufacturing recording a decline of 20,000 jobs while community services added 29,000. These figures illustrate why workforce decisions should consider the needs of individual industries rather than rely on broad labour market trends alone.
Within your organisation, review:
- Total employee headcount.
- Headcount by department and location.
- Vacant positions and open roles.
- Full-time and part-time workforce distribution.
- New hires compared with employee departures.
- Planned recruitment and workforce expansion.
For example, if your sales department is growing but your customer support team is struggling to manage demand, you may need to reconsider how your workforce is distributed. You should also assess whether planned recruitment aligns with your 2027 business goals and available budget.
If your organisation is subject to employment equity reporting requirements, include workforce representation across relevant occupational levels in your review. This information will help you determine whether you need to recruit, restructure teams, develop existing employees or redistribute responsibilities in the coming year.
How to use workforce metrics to set your 2027 HR priorities
Reviewing workforce metrics is only useful if you turn the findings into practical decisions. Once you have assessed the seven areas, identify the issues that need the most attention.
Use these steps to guide your planning:
- Identify recurring challenges: Look for patterns in turnover, absenteeism, engagement and productivity data.
- Compare results: Review your current figures against previous periods and internal targets to understand whether performance is improving or declining.
- Prioritise business needs: Identify which workforce challenges are most likely to affect your organisation’s objectives.
- Allocate resources: Determine where you need to invest in recruitment, training, employee retention or improved HR processes.
- Set measurable goals: Establish clear HR targets for 2027 and decide how you will monitor progress throughout the year.
For example, if your turnover rate has increased while engagement scores have declined, improving employee retention may become a priority. If overtime expenditure is rising alongside missed productivity targets, reviewing workloads and workforce capacity may be more urgent.
The aim is to build an HR plan that responds to what your workforce data actually shows.

How Factorial helps you make better workforce decisions
Reviewing workforce metrics becomes easier when your employee information is organised and accessible. Factorial’s HR software brings people management and reporting tools together, helping you monitor important workforce information and make more informed decisions.
With Factorial, you can:
- Monitor workforce data: Use HR reports and analytics to review information such as headcount, employee turnover, absences and workforce costs.
- Track employee attendance: Manage working hours, time tracking and absences to improve visibility into workforce availability.
- Review employee performance: Set goals, manage performance reviews and collect feedback to understand employee progress.
- Monitor training: Keep track of employee training participation, progress and associated costs.
Rather than relying on disconnected spreadsheets and manual reporting, you can bring relevant workforce information together and use it to guide your HR planning.
Explore Factorial to track workforce metrics and make better use of your people data.

Workforce Metrics FAQs
Some important workforce metrics include employee turnover, absenteeism, engagement, labour costs, training participation, productivity and headcount. The right metrics depend on your organisation's size, industry and business objectives.
You should review key workforce metrics monthly or quarterly, depending on the metric and your organisation's needs. A year-end review can help you identify longer-term trends and set priorities for the following year.
HR metrics measure the performance of HR activities, such as recruitment and training. Workforce metrics focus more broadly on employee-related information, including headcount, turnover, productivity and workforce costs.
You can assess workforce effectiveness by reviewing productivity, employee performance, engagement, attendance and workforce costs against organisational goals. No single metric provides a complete picture.
Yes, dedicated HR and business management platforms such as Factorial help centralise employee information and generate reports to support workforce planning.